
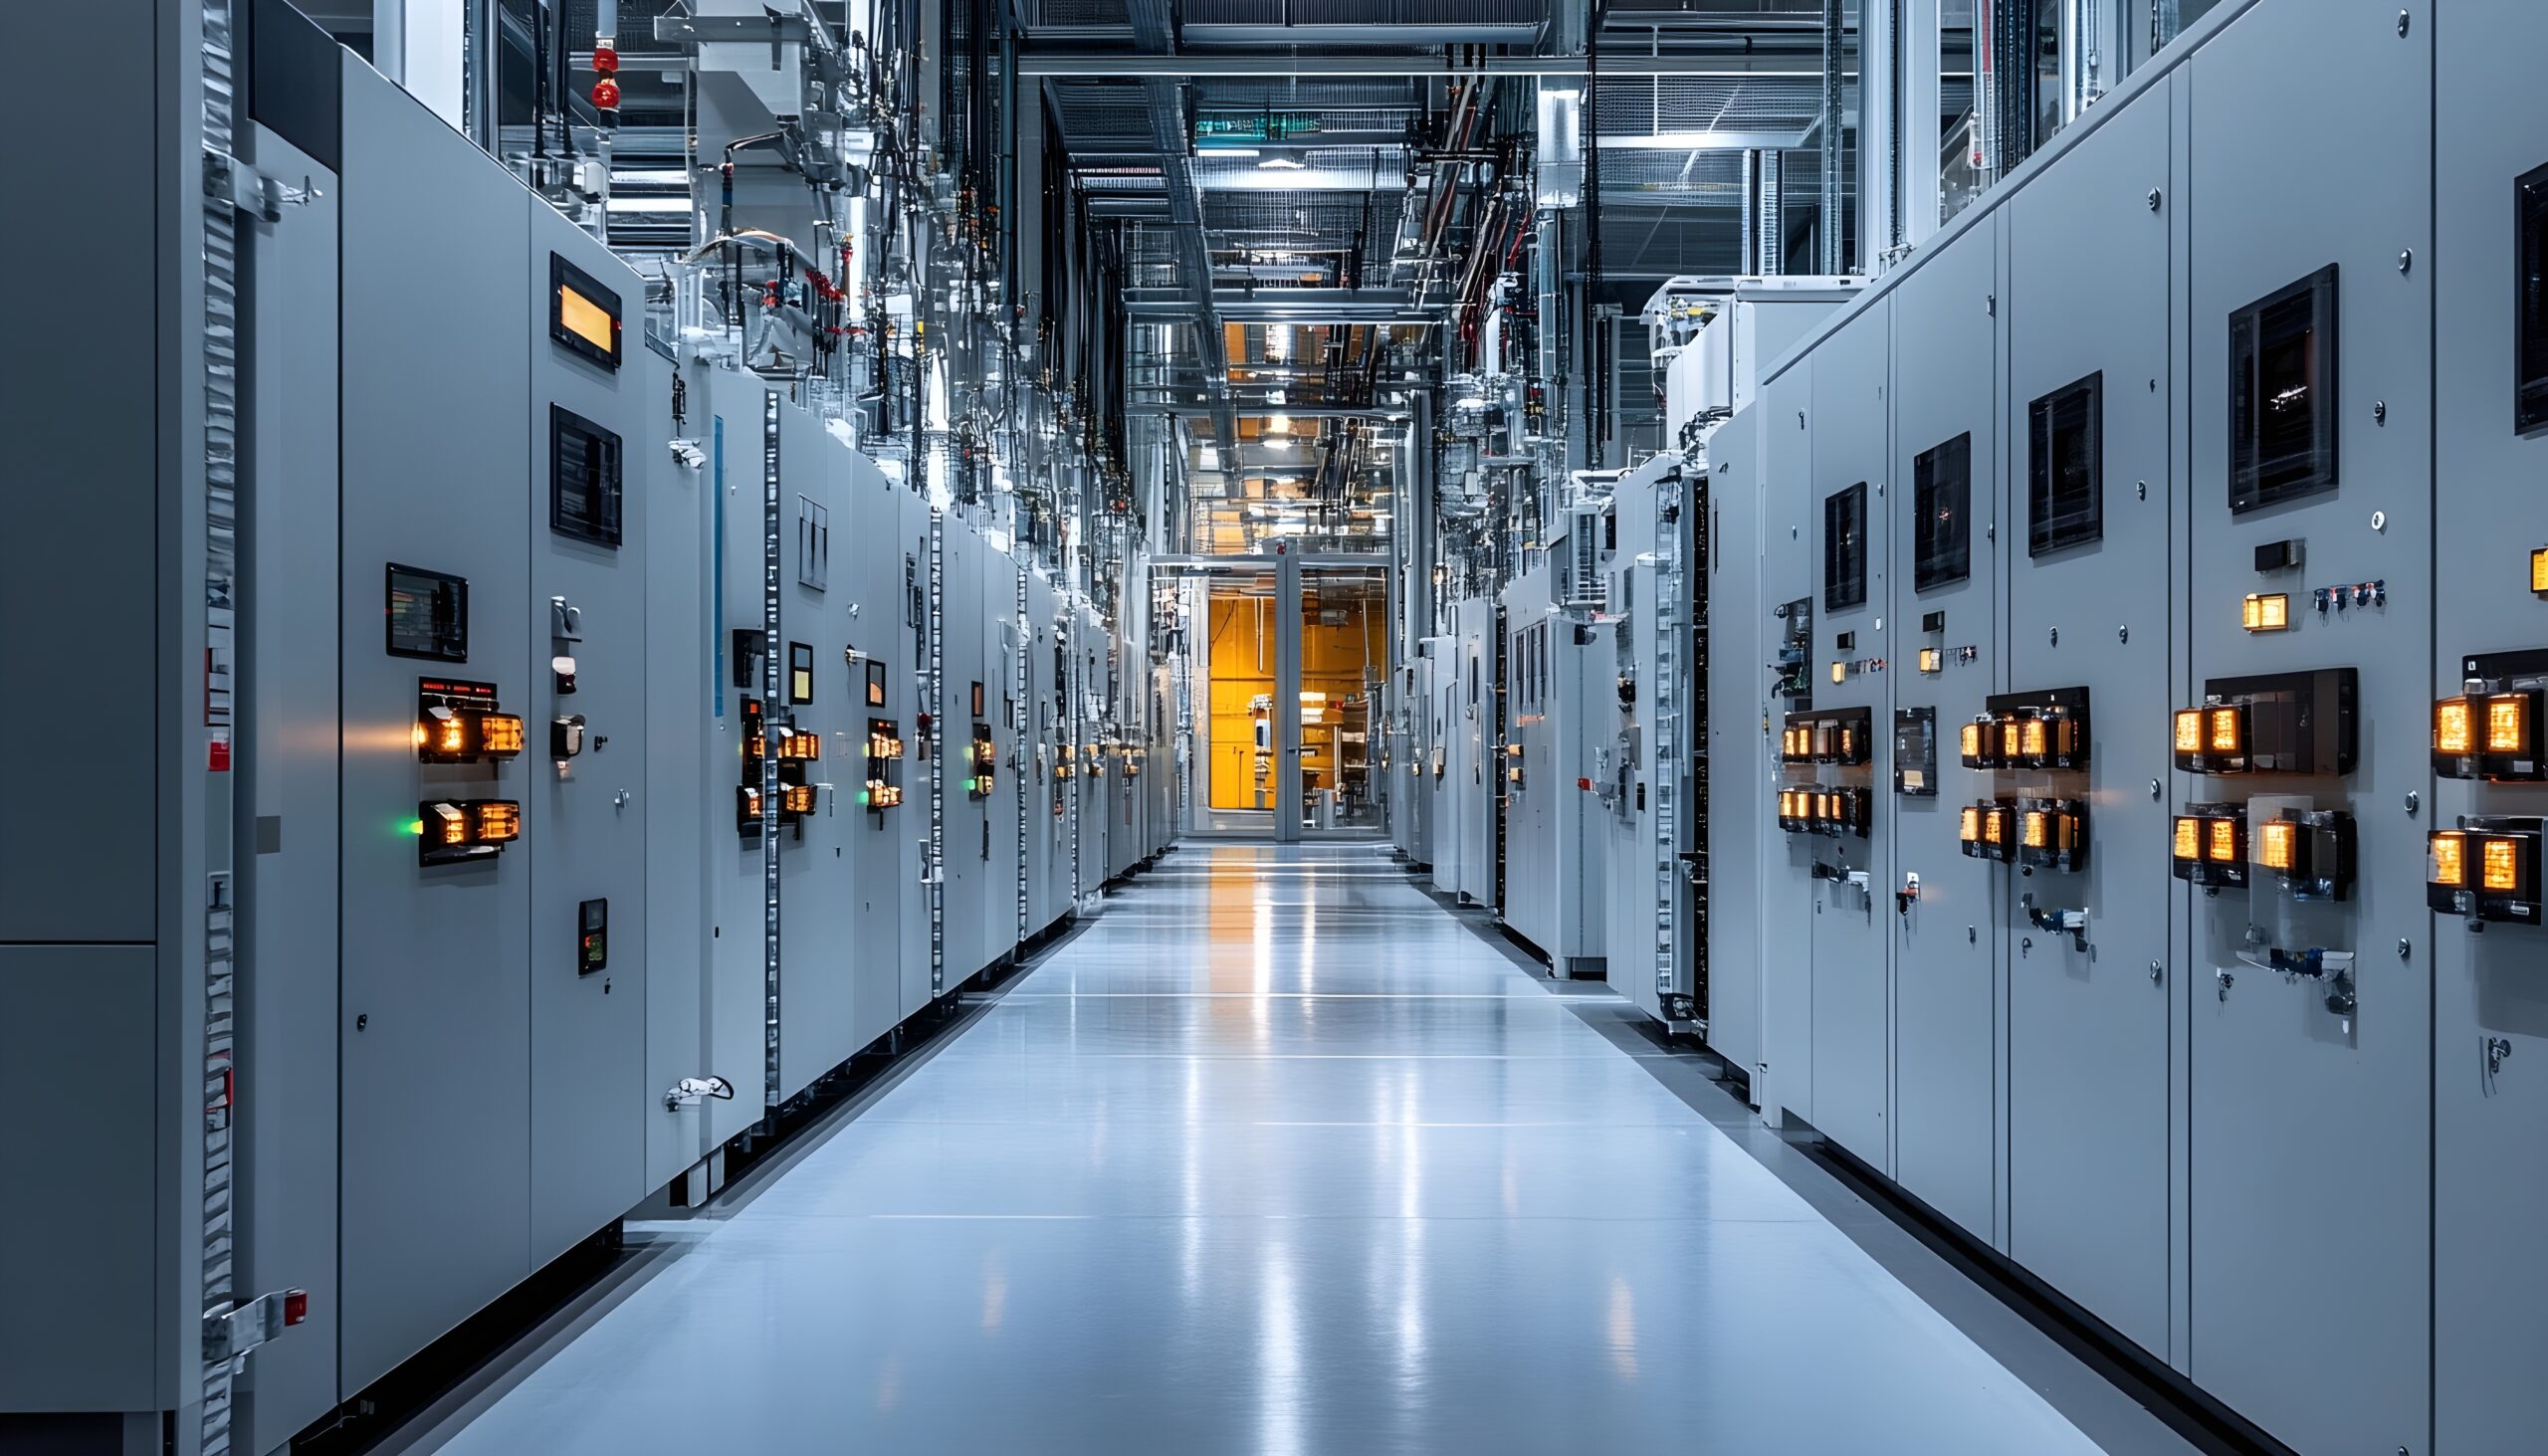
From a desk in Tokyo, overseas plants are always visible.
Overview
| Client | Major domestic industrial machinery manufacturer (company name not disclosed) |
| Project Type | Construction of Remote Energy Monitoring System for Overseas Plants |
| Period | 18 months (2 months for requirements definition + 8 months for building + 8 months for phased implementation) |
| Target Locations | A total of 4 plants in Southeast Asia and the Middle East |
| Technology Provided | Multi-motor drive control + PC-based energy monitoring + Internet-based remote monitoring |
Client Challenges
The plants we have overseas are mainly operated by local staff.
Daily operations are fine, but delays in making decisions when abnormalities occur, data not being retained, and being difficult to share with headquarters.
These three points have been long-standing challenges.
Local PLC logs remain on-site and only appear in monthly reports.
Moreover, for SDGs reporting, we wanted to track energy usage at each site on a device basis.
What we worked on
Phase 1. Assessment of the current status of existing equipment (2 months)
4. Conduct on-site inspections of all existing control panels, sensor configurations, and communication environments at the plant.
Organized the different voltages, frequencies, communication standards, and language environments for each plant.
Phase 2. Hierarchical Monitoring Architecture Design (2 months)
[Local Layer] Motors, Sensors, PLCs at Each Plant
↓ (Local Data Collection Server)
[Edge Layer] Plant-Scale Aggregation: Analysis of PC Torque Ripple/Harmonics/Power Factor
↓ (TLS over Internet)
[Hub Layer] Centralized Server Dashboard at Tokyo Headquarters
↓
[Visualization] 4 Comparison dashboard across plants
Phase 3. Phased implementation (8 months)
To reduce risk, four plants are being introduced in phases every two months.
For one month after each plant’s introduction, we worked alongside local staff to establish a headquarters operations system.
Outcomes (measurements six months after implementation)
| indicator | Before Implementation | After Introduction | improve | How it works for daily life |
| From anomaly detection Time to Headquarters Recognition | 36 hours | 22 points | -98% | Suppressing wasted energy consumption |
| Man-hours for preparing monthly reports (On-site) | 18 hours | 2 hours | -89% | Local staff can spend more time on site improvements. |
| of energy consumption Visualizing Granularity | Plant unit (Monthly) | Motor unit (Real-time) | — | Improving the accuracy of SDGs reporting and seeing the effectiveness of reduction measures |
| From headquarters Number of remote tuning cases | 0 items / month | Average 12 cases per month | — | Reducing CO₂ emissions through improvements that do not involve business trips |
| Trouble Average Recovery Time | 14 hours | 3.2 Time | -77% | Reducing economic losses and unnecessary electricity consumption from factory shutdowns |
I’m embarrassed that the normal state of ‘constantly viewing all plants on screen’ has not been realized until now.
Airsurf visualized protocols, power quality, and motor drives—from a physical layer that most SI companies wouldn’t tackle.
Simply implementing monitoring SaaS doesn’t reach this level of granularity.
For the first time, the supporting data for the SDGs report is now in a state where we can ‘proudly present it.’ ── Head of Overseas Business Department (summarized with permission)
What I learned
Remote energy monitoring of factories and plants is not enough to just “create a dashboard.”
By layering physical quantities such as torque ripples, harmonics, and power factors to the point where they can be measured, “intervention from headquarters” becomes only possible.
And the visible energy usage later becomes corporate SDG reports and shareholder disclosures,
Ultimately, this builds up to reducing CO₂ emissions across the entire supply chain.
Ordinary physical layer work can lead to global discussions… that’s part of the appeal of IT-related businesses.